
Most Profitable Industries in 2026: A Data-Backed Report
In this report: net margins, salaries, and the sectors where profit actually concentrates in 2026.

Last updated: September 2026. Index figures reflect FactSet's Q2 2026 final and Q3 2026 estimates (as of September 18, 2026); industry margins reflect NYU Stern's January 2026 dataset.
The blended net profit margin for the S&P 500 hit 17.0% in Q2 2026, the highest level recorded since FactSet began tracking the metric in 2009 (Source: FactSet).
Best Firms is where operators, founders, and investors go for benchmark data that has been checked against primary sources rather than recycled from blog roundups.
Record index-level margins do not mean broad prosperity, though.
Profitability in 2026 is concentrated in a narrow band of sectors built on intellectual property, near-zero marginal cost, and pricing power, while the majority of industries operate on single-digit net margins that have barely moved in a decade.
This report breaks down which industries are actually the most profitable in 2026, how they earn it, what they pay, and where the margins are quietly eroding.
Key Takeaways
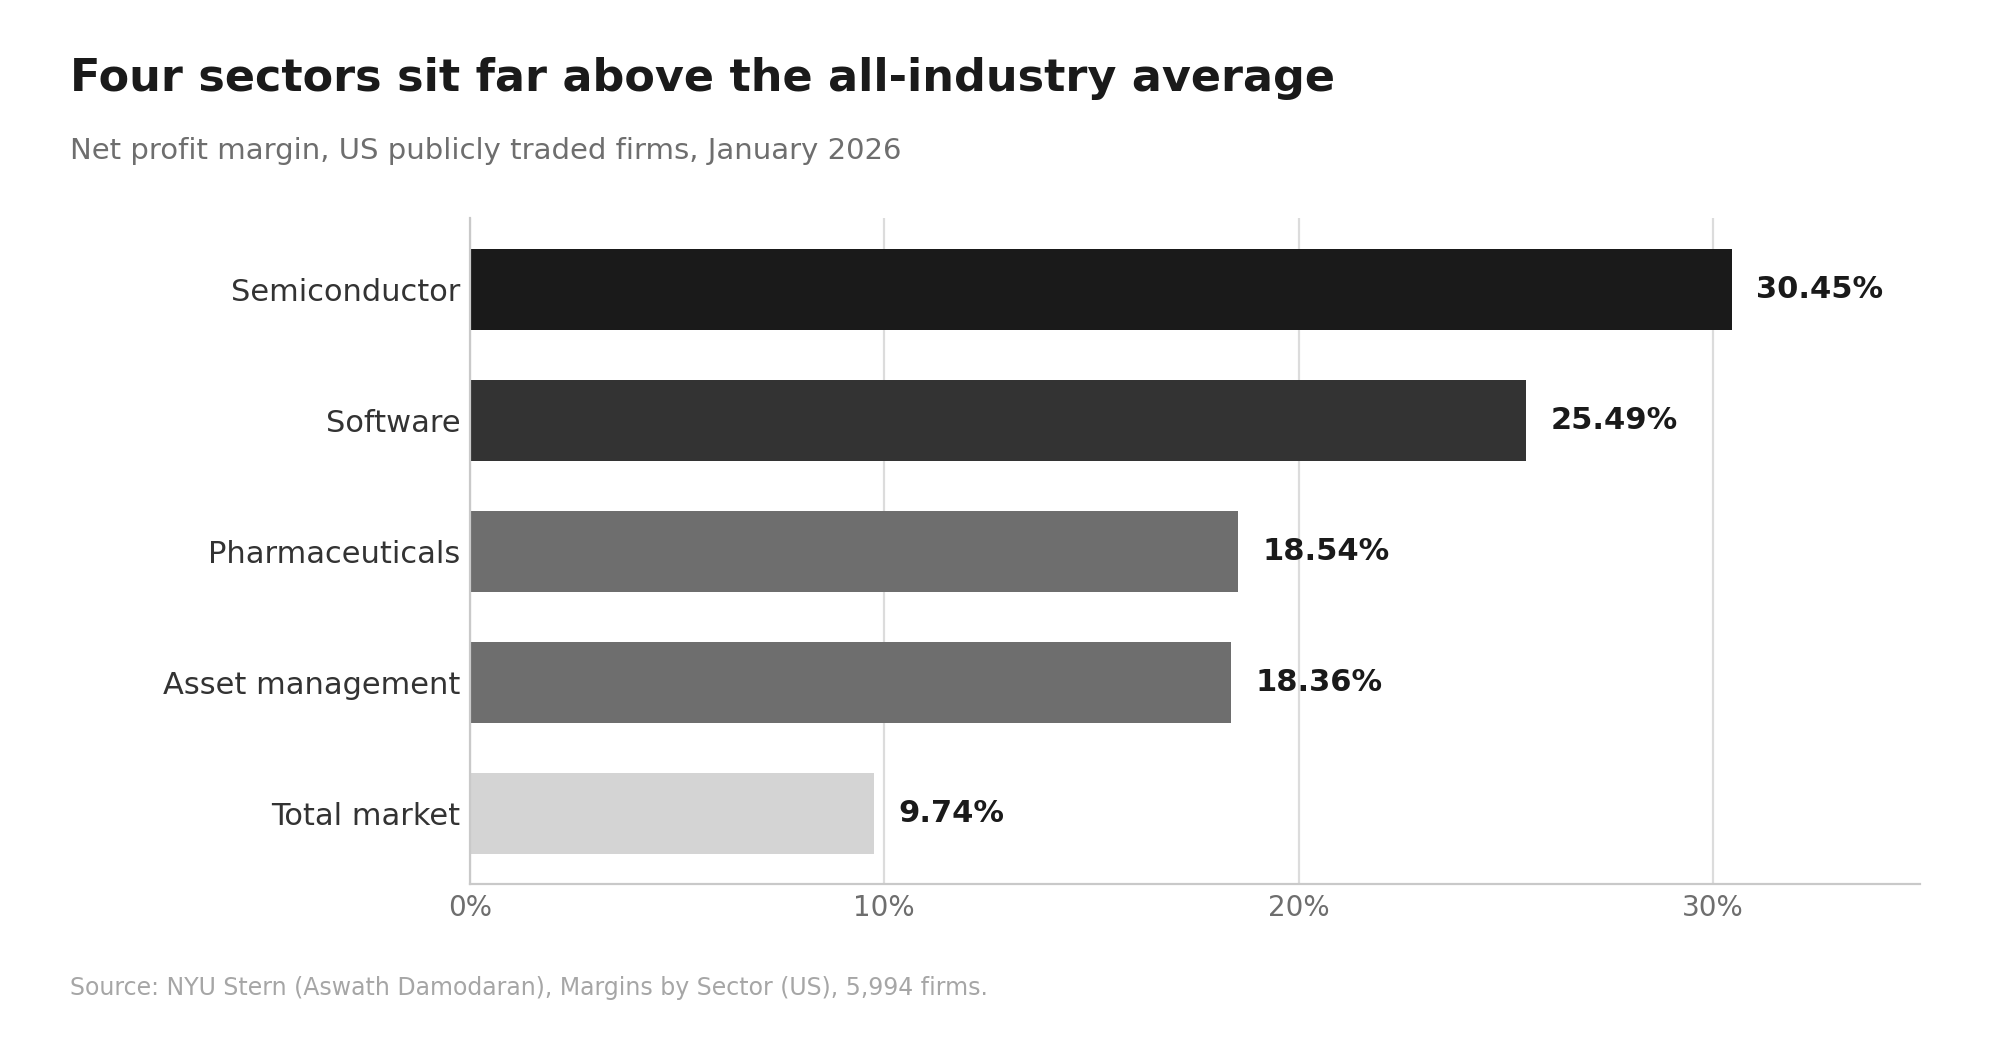
- Semiconductors lead all US industries at a 30.45% net margin (NYU Stern).
- Entertainment software follows at 29.93%; system and application software sits at 25.49% (NYU Stern).
- The all-industry US public company average is just 9.74% net margin (NYU Stern).
- The S&P 500 net margin hit a record 17.0% in Q2 2026, and FactSet expects 15.0% for Q3 (FactSet).
- Information sector jobs average $184,220, the highest of any US sector (Salary Converter).
How Profitability Is Actually Measured
Rankings of "most profitable industries" contradict each other because they measure different things.
Three metrics dominate, and each produces a different leaderboard:
- Net profit margin divides net income by revenue. It is the cleanest tool for comparing sectors because it normalizes for size.
- Absolute net income ranks companies, not industries, and is dominated by a handful of mega-caps.
- Percentage of profitable firms measures how reliably an industry produces winners, which matters more to a buyer or operator than the sector average does.
A fourth lens, return on invested capital, explains why some sectors compound faster than others.
Tobacco, software, and financial services consistently rank among the highest ROIC industries because each dollar of reinvestment generates outsized returns.
There is also a gross-versus-net trap.
The data shows that a high gross margin does not guarantee profitability. Advertising posts a 36.24% gross margin yet a negative 0.30% net margin in aggregate, because operating spend and financing costs consume the gross advantage (Source: NYU Stern).
The 2026 Profit Landscape
The index-level picture looks extraordinary, but the concentration behind it is the real story.
Excluding Alphabet and Amazon, the S&P 500 blended net profit margin for Q2 2026 drops from 17.0% to 15.1%, still a record (Source: FactSet).
The trend has been building for several quarters. The net profit margin for the S&P 500 reached a then-record 14.8% in Q1 2026, and the year-ago Q2 2025 margin was 12.9% (Source: FactSet).
For context, the 5-year average net profit margin for the index is 12.4% (Source: FactSet).
Sector movement in Q2 2026 was sharply uneven. Communication Services expanded from 15.2% to 28.6% year over year, Information Technology from 25.2% to 32.3%, and Consumer Discretionary from 9.4% to 16.5%, while Health Care was the only sector reporting a year-over-year decline in earnings (Source: FactSet).
This is the context for any conversation about the biggest industries in the US: size and profitability are not the same variable.
The Most Profitable Industries by Net Margin
The benchmark dataset for sector margins is NYU Stern's Damodaran series, updated each January (Source: NYU Stern).
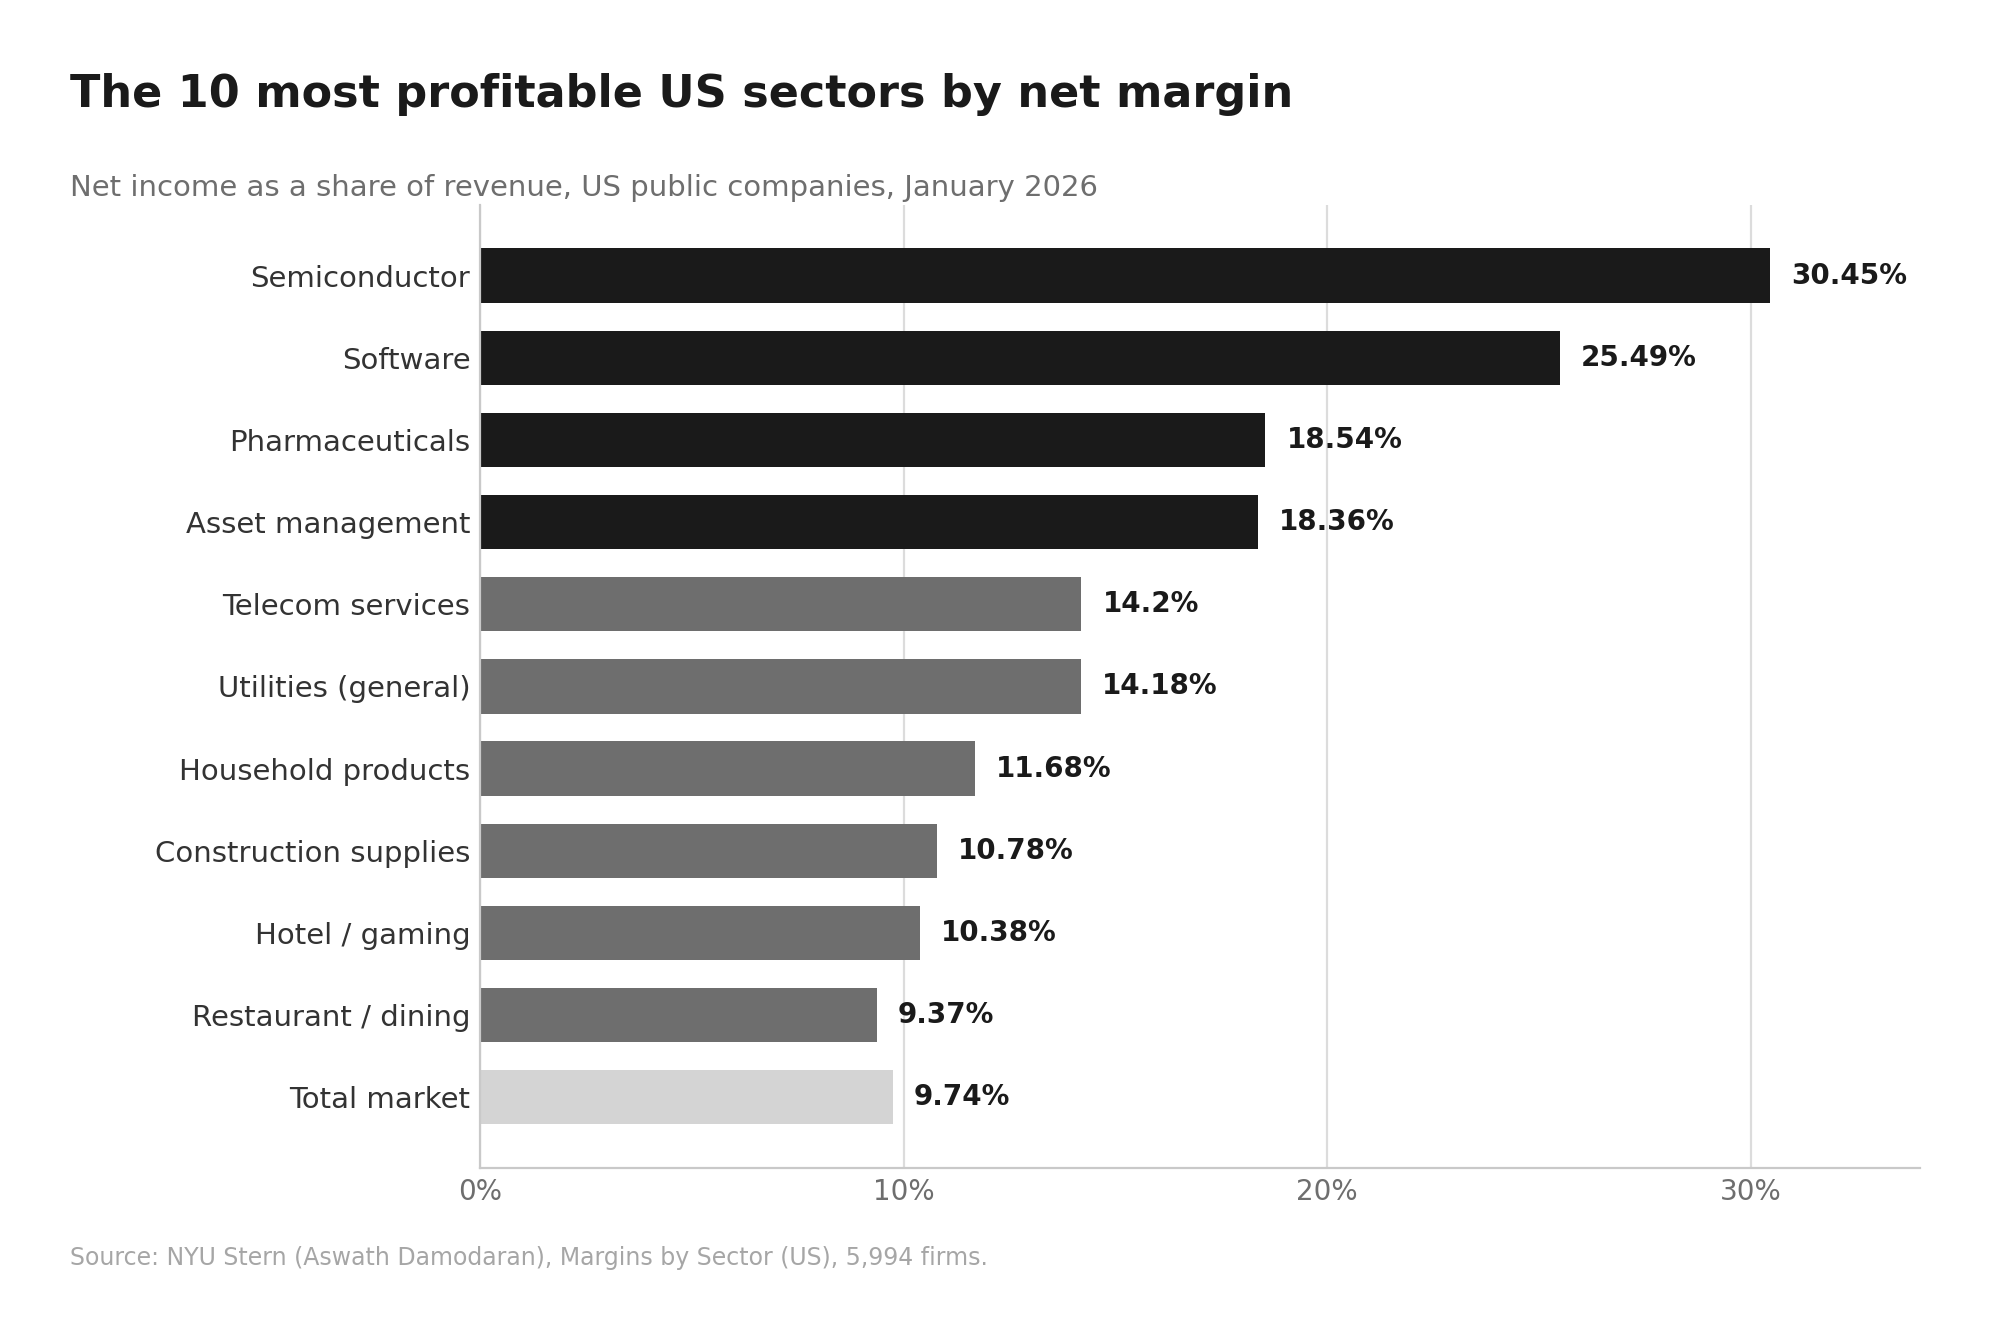
The January 2026 file covers 5,994 publicly traded US firms and puts the aggregate net profit margin at 9.74%, with a 37.76% gross margin and a 14.39% pre-tax, pre-stock-compensation operating margin (Source: NYU Stern).
| Rank | Industry (Damodaran) | Gross margin | Operating margin (pre-tax, pre-SBC) | Net margin |
|---|---|---|---|---|
| 1 | Semiconductor | 58.97% | 40.37% | 30.45% |
| 2 | Software (Entertainment) | 66.45% | 41.35% | 29.93% |
| 3 | Bank (Money Center) | 100.00% | 2.30% | 28.89% |
| 4 | Precious Metals | 55.02% | 41.01% | 28.59% |
| 5 | Banks (Regional) | 99.62% | 1.60% | 27.49% |
| 6 | Tobacco | 64.31% | 44.04% | 26.65% |
| 7 | Software (System & Application) | 71.72% | 40.81% | 25.49% |
| 8 | Transportation (Railroads) | 50.96% | 37.90% | 24.73% |
| 9 | Real Estate (General/Diversified) | 51.23% | 23.61% | 23.77% |
| 10 | Retail (REITs) | 78.61% | 41.63% | 23.00% |
| 11 | Financial Svcs. (Non-bank & Insurance) | 69.20% | 20.85% | 22.19% |
| 12 | Semiconductor Equip | 46.32% | 28.34% | 21.32% |
| 13 | Utility (Water) | 58.97% | 34.46% | 21.16% |
| 14 | Drugs (Pharmaceutical) | 71.73% | 31.24% | 18.54% |
| 15 | Investments & Asset Management | 69.77% | 30.59% | 18.36% |
| Telecom. Services | 58.82% | 21.05% | 14.20% | |
| Utility (General) | 44.18% | 23.84% | 14.18% | |
| Total Market | 37.76% | 14.39% | 9.74% |
Source: NYU Stern (Aswath Damodaran), Operating and Net Margins by Sector (US), data as of January 2026. Bank margins use a revenue definition that isn't comparable with operating companies, so read those two rows with care.
Tobacco's after-tax, lease and R&D adjusted operating margin is even higher at 37.34%, though its regulatory and volume trajectory makes it a poor template for new entrants (Source: NYU Stern).
Why the Top Tier Stays on Top
Four structural traits, not superior management, separate the top margin tier from the bottom:
- Near-zero marginal cost. Software and semiconductors sell each additional unit for almost nothing once the first is built, while grocery pays full cost of goods on every sale, capping net margin at 1.32% (NYU Stern).
- Defensible intangibles. Patents, platforms, and switching costs let pharmaceutical and software firms hold price. Commoditized output cannot.
- Capital that scales without headcount. Asset managers keep 18.36% net because fees rise with assets under management rather than with staff count (NYU Stern).
- Pricing power from concentration or regulation. Railroads at 24.73% and water utilities at 21.16% operate in concentrated, often regulated markets that limit new entrants (NYU Stern).
The counterexample is instructive. Advertising agencies add people to add revenue, which is why the sector's gross margin never reaches the bottom line (Source: NYU Stern).
Apparel tells a similar story: a 56.88% gross margin collapses to 3.85% net once operating and financing costs land (Source: NYU Stern).
The Most Profitable Companies, and What They Reveal
Absolute profit ranks differently than margin, and the latest filings show how fast the leaderboard moves when one-off investment gains hit the income statement.
| Company | Latest reported quarter (as of Sep 2026) | Net income | Notes |
|---|---|---|---|
| Alphabet | Q2 2026 (ended Jun 30) | $112.2B | Includes a $99.0B gain on equity securities |
| Amazon | Q2 2026 (ended Jun 30) | $62.6B | Includes non-operating investment gains |
| Nvidia | Q2 FY27 (ended Jul 26) | $59.7B | Revenue $96.2B, up 106% |
| Microsoft | Q4 FY26 (ended Jun 30) | $35.8B | FY2026 net income $133.7B |
| Apple | Q3 FY26 (ended Jun 27) | $29.8B | Up from $23.4B a year earlier |
Sources: Alphabet, Amazon, Nvidia, Microsoft, Apple
Alphabet reported Q2 2026 net income of $112.2 billion, but that figure includes a $99.0 billion gain on equity securities, so it overstates the underlying earnings power of the business (Source: Alphabet).
Nvidia is the cleaner signal: $59.7 billion of GAAP net income on $96.2 billion of revenue in a single quarter, as AI infrastructure spending fueled one of the fastest profit expansions in corporate history (Source: Nvidia).
Financial services remains the most consistent profit pool by breadth rather than by peak. The sector accounts for roughly 12% of the combined net income of the world's 25 most profitable companies (Source: Top10-Best).
Anyone tracking the fastest growing companies in the US will notice the same names appearing in both rankings.
The Overlooked Metric: How Many Firms Actually Profit
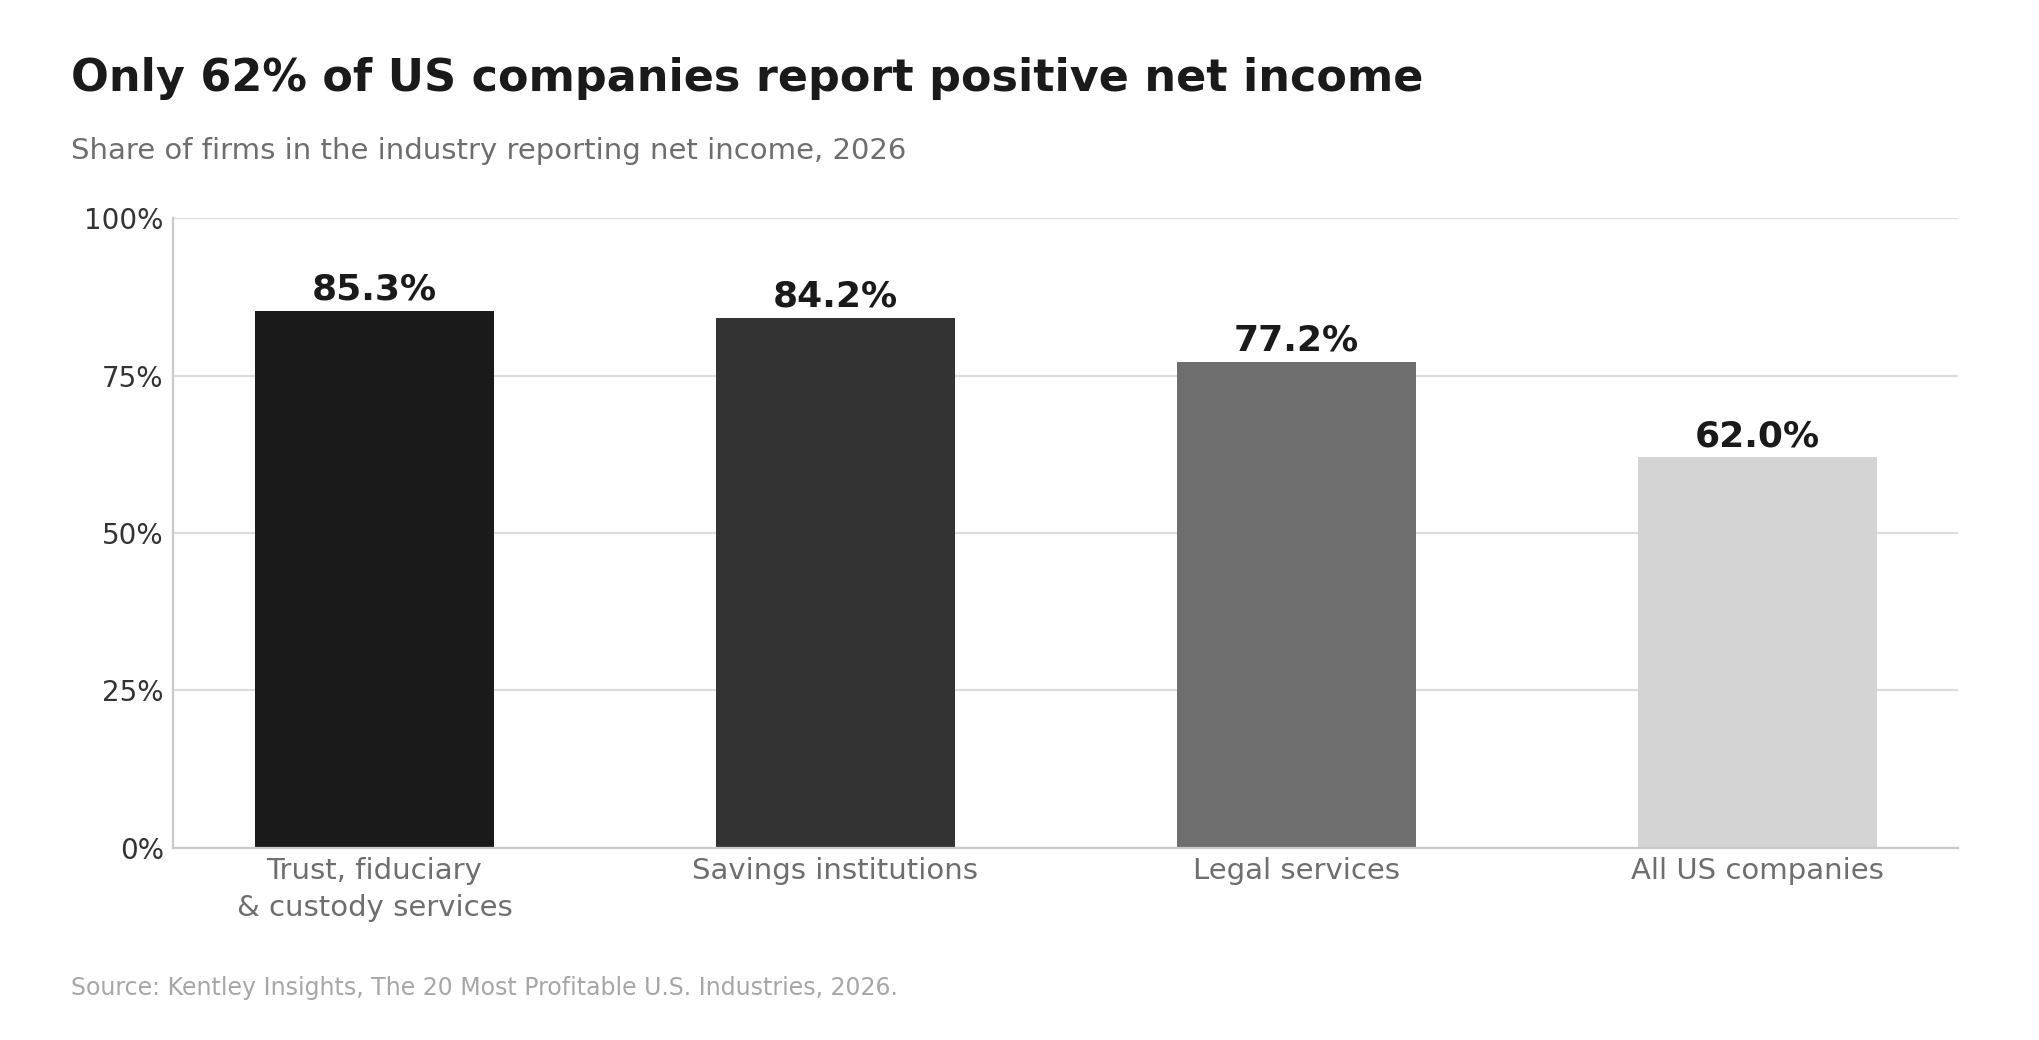
Average margin hides survivorship. Nationwide, only 62% of US companies generate net income, and among those profitable companies the average net income margin stands at 10.9% (Source: Kentley Insights).
Some industries are far more reliable than the average suggests.
Trust, fiduciary, and custody services top the 2026 ranking of most profitable US industries by reliability, with 85.3% of firms reporting positive net income (Kentley Insights).
Legal services run at 77.2% profitable and savings institutions at 84.2% (Source: Kentley Insights).
For an operator or acquirer, a sector with a modest average margin and a high profitable-firm rate is often a better bet than a high-margin sector where half the field loses money.
The Least Profitable Industries
Contrast sharpens the picture. The bottom of the January 2026 table is populated by high-volume, low-differentiation businesses.
| Sector | Net margin |
|---|---|
| Food wholesalers | 1.17% |
| Healthcare support services | 1.25% |
| Auto & truck | 1.29% |
| Grocery retail | 1.32% |
| Food processing | 2.82% |
| Trucking | 3.79% |
| Apparel | 3.85% |
| Computer services (IT) | 4.45% |
| General retail | 5.61% |
| Engineering/construction | 5.94% |
Source: NYU Stern (Damodaran), January 2026.
The retail figure holds up under cross-check.
CSIMarket independently reports the retail sector at 5.92% net margin on a trailing-twelve-month basis for Q2 2026, close to Damodaran's 5.61% (Source: CO Consulting).
The Most Profitable Industries at Small Business Scale
Public company data overstates margins for the small private firms that dominate services and trades. The IRS file tells a different story, and a better one for owner-operators.
Professional, scientific, and technical services sole proprietors report a 41.0% profit margin on $247.8 billion in receipts, the highest of any US sector (Source: Hostinger).
At the acquisition end of the market, sellers' discretionary earnings margins run higher still.
Accounting and bookkeeping firms post roughly an 85% SDE margin, rental and other real estate about 78%, e-commerce about 64%, and professional services about 50% (Source: Clef). Clef
The base rates matter as much as the margins. There are 36.2 million small businesses in the US, representing 99.9% of all US companies and employing approximately 62.3 million people, but roughly 18% of new firms close within their first year and about 50% within five years (Source: Hostinger).
More context on the sector sits in this breakdown of small business statistics, and BestFirms covers the entry side in its guide to the best businesses to start in 2026.
What the Most Profitable Industries Pay
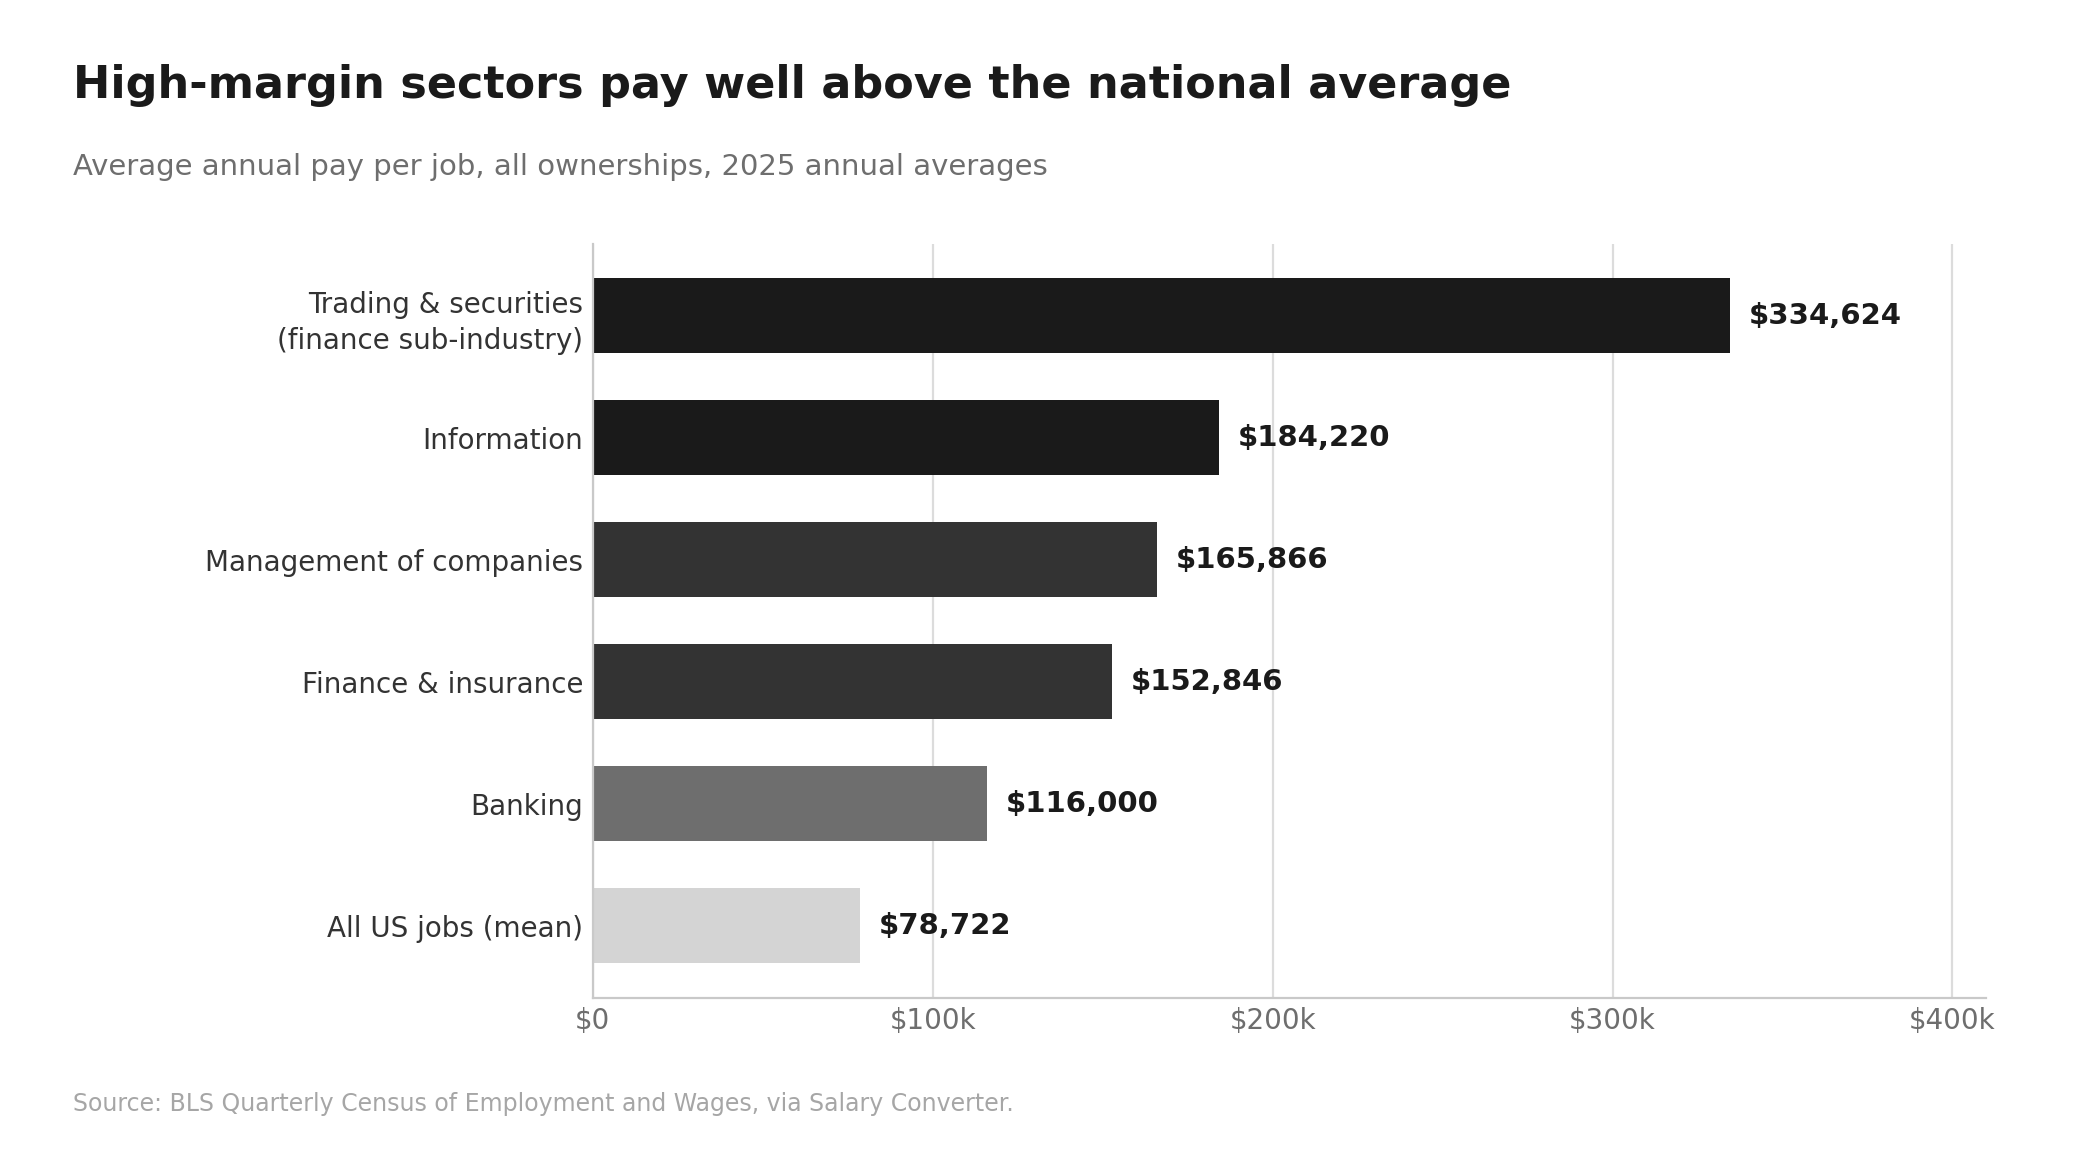
High-margin sectors pay high wages, because they can. Sector pay follows the same concentration pattern as sector profit.
| Sector | Average annual pay |
|---|---|
| Information | $184,220 |
| Management of companies & enterprises | $165,866 |
| Finance & insurance | $152,846 |
| All US jobs (mean) | $78,722 |
Source: Salary Converter
Information averages $184,220 against $152,846 for finance and insurance, employs just 3.0 million people, under 2% of US jobs, and pays 2.3 times the all-industry average while posting the fastest one-year gain of any sector at 9.3% (Source: Salary Converter).
Finance has the higher ceiling: its trading and securities sub-industry averages $334,624, while banking averages closer to $116,000 (Source: Salary Converter).
At the occupation level, the same pattern repeats. The median annual wage for business and financial occupations was $82,660 in May 2025, against $50,980 for all occupations (Source: BLS).
Financial managers average $166,050, lawyers $163,770, software developers $137,650, and nurse anesthetists $248,320 (Source: Annual Pay Calculator).
As a general rule, finance, technology, and consulting pay above the occupation average for the same role, while retail and nonprofits pay below it.
Pay dispersion by career stage is covered further in this analysis of average salary by age, and BestFirms tracks the top end in its report on the highest paying tech companies in 2026 and its 2026 startup salaries report.
Where Margins Are Under Pressure in 2026
Three pressure points are worth watching;
- AI infrastructure costs are compressing software gross margins. The historically high SaaS gross margin is no longer automatic once inference costs enter cost of goods sold.
BestFirms covers the new numbers in its analysis of AI and SaaS gross margins, with further benchmarks in this breakdown of SaaS gross margin in 2026.
- Healthcare is the one sector moving backwards. Health Care was the only S&P 500 sector reporting a year-over-year decline in earnings for Q2 2026, and its net margin slipped to 7.1% from 8.1% (Source: FactSet).
- Financial margins depend on rate paths. For real estate loan providers and savings institutions, net interest margin compression remains a near-term profitability risk as deposit costs lag rate reductions (Source: Kentley Insights).
Analysts still expect the elevated regime to hold.
The estimated net profit margin for Q3 2026 stands at 15.0%, below Q2's record but above the 5-year average, as of September 18, 2026 (Source: FactSet).
How to Read This Data Before Acting on It
Four caveats govern every number above.
The Damodaran series is revenue-weighted, so a few giants can pull a sector value. It covers public companies only and overstates margins for small private firms.
Sector definitions differ between Damodaran, CSIMarket, and the IRS, so cross-source comparisons are approximate. FactSet's index figures are also quarterly and can include one-off gains, while Damodaran's are annual.
The IRS Statistics of Income corporate data used for private-firm context lags by roughly three years, with the most recent complete file covering Tax Year 2022 (Source: CO Consulting).
Treat the public sector row as a ceiling, not a private-firm target.
Operators evaluating their own position should also weigh growth against profitability using a combined measure such as the Rule of 40, since margin alone rewards stagnation.
What This Means for Founders, Investors, and Operators
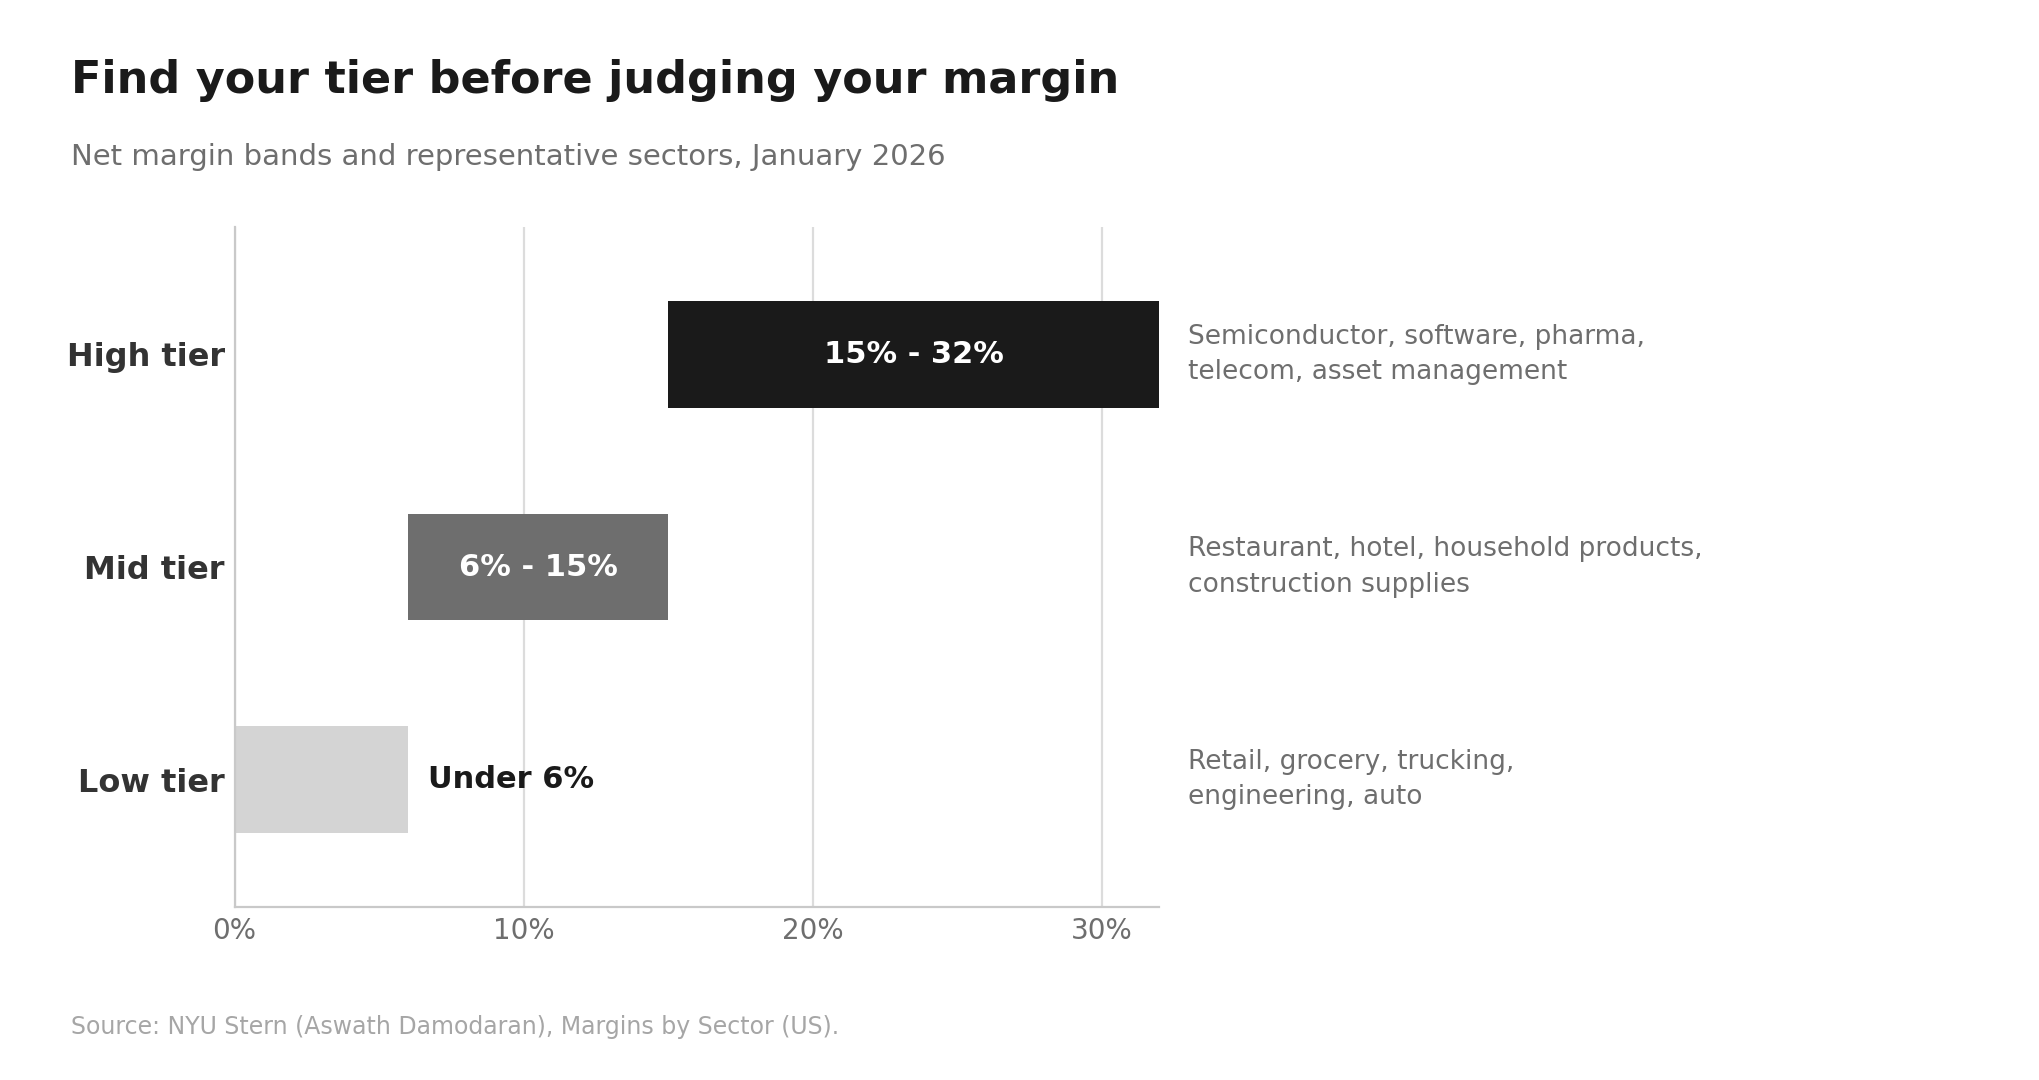
- For founders, the practical read is that sector choice sets a hard ceiling.
Moving toward recurring, IP-backed, low-marginal-cost revenue does more for margin than any operational improvement inside a structurally thin industry.
- For investors, margin alone is half the picture. Pair it with the percentage of profitable firms and the capital required to operate.
A top-tier margin sector that demands billions in fab capex is not accessible in the way an asset management model is.
- For operators already inside a sector, benchmark against your own row, not the market aggregate.
A mid-single-digit net margin is weak for software and strong for grocery. Efficiency of converting gross profit into net profit is where most of the recoverable value sits, and it is measurable this quarter.
Marketing efficiency is a common lever there, with benchmarks available in this collection of marketing ROI statistics.
Conclusion
Best Firms exists to give operators and investors benchmark data they can defend in a board meeting, sourced and dated rather than rounded off.
The 2026 profitability picture is one of record aggregate margins built on a narrow foundation: semiconductors at 30.45%, entertainment software at 29.93%, system and application software at 25.49%, and pharmaceuticals at 18.54% sit far above a total-market average of 9.74%, while grocery at 1.32% and food wholesale at 1.17% grind along at the bottom (Source: NYU Stern).
Absolute profit concentrates further still, with a handful of technology firms accounting for most of the index-level margin record.
The industries that keep the most of every dollar share four traits: near-zero marginal cost, defensible intangibles, capital that scales without headcount, and pricing power from concentration or regulation.
Everything else competes on volume.
Read Next
Building a finance or data team to protect your margins? Best Firms compares vetted recruiting partners by fee, speed and guarantee.
FAQs
What is the most profitable industry in 2026?
Semiconductors, at a 30.45% net profit margin, according to NYU Stern's January 2026 data covering 5,994 US public firms. Entertainment software follows at 29.93%, and system and application software sits at 25.49% (NYU Stern).
What is the average profit margin across all industries?
9.74% net, on a 37.76% gross margin and a 14.39% pre-tax, pre-stock-compensation operating margin, based on the January 2026 NYU Stern dataset. Excluding financials, the aggregate net margin falls to 8.56% (NYU Stern).
Which industries have the lowest profit margins?
Food wholesalers at 1.17%, healthcare support services at 1.25%, auto and truck at 1.29%, and grocery retail at 1.32% (NYU Stern). These are high-volume, low-differentiation sectors that compete on turnover rather than margin per sale.
Which industry pays the highest average salary?
Information, at $184,220 per year, covering software, streaming, telecom, and data processing. Management of companies follows at $165,866 and finance and insurance at $152,846, against an all-industry mean of $78,722 (Salary Converter).
What is the most profitable small business industry?
What is the S&P 500 profit margin right now?
The final blended net profit margin for Q2 2026 was 17.0%, a record since 2009, and analysts expect 15.0% for Q3 2026 as of September 18, 2026 (FactSet).
Disclaimer: This content is provided for informational purposes only and does not constitute legal, financial, or investment advice. Margin figures reflect the FactSet and NYU Stern releases cited above as of September 2026; quarterly company results can include one-off gains and are subject to revision.