
Biggest Industries in the US: A 2026 Data Report
In this report: the biggest industries in the US by GDP, jobs and pay, using 2026 federal data.

Health care now employs 18.5 million Americans, roughly 11.7 percent of all nonfarm payroll jobs and about 1.5 times the size of the entire manufacturing workforce (Source: U.S. Bureau of Labor Statistics).
This report is a data-first breakdown of the biggest industries in the United States, built on primary federal releases published in 2026 rather than recycled estimates.
"Biggest" is not one number: an industry can dominate output, headcount, or payroll without leading in the other two, and the rankings change depending on which measure you use.
What follows is a full breakdown of the largest US industries by GDP contribution, employment, average pay, growth trajectory and structural risk, so you can see exactly which sectors carry the economy and where they are heading.
Key Takeaways
- Real estate and professional services lead US GDP; health care leads job creation.
- Health care employs 18.5 million people and is still adding jobs monthly.
- Retail and leisure employ tens of millions but pay under $41,000 annually.
- Utilities, information and finance pay the most, at $96,000 to $125,000.
- AI and data center investment now drives roughly a third of GDP growth.
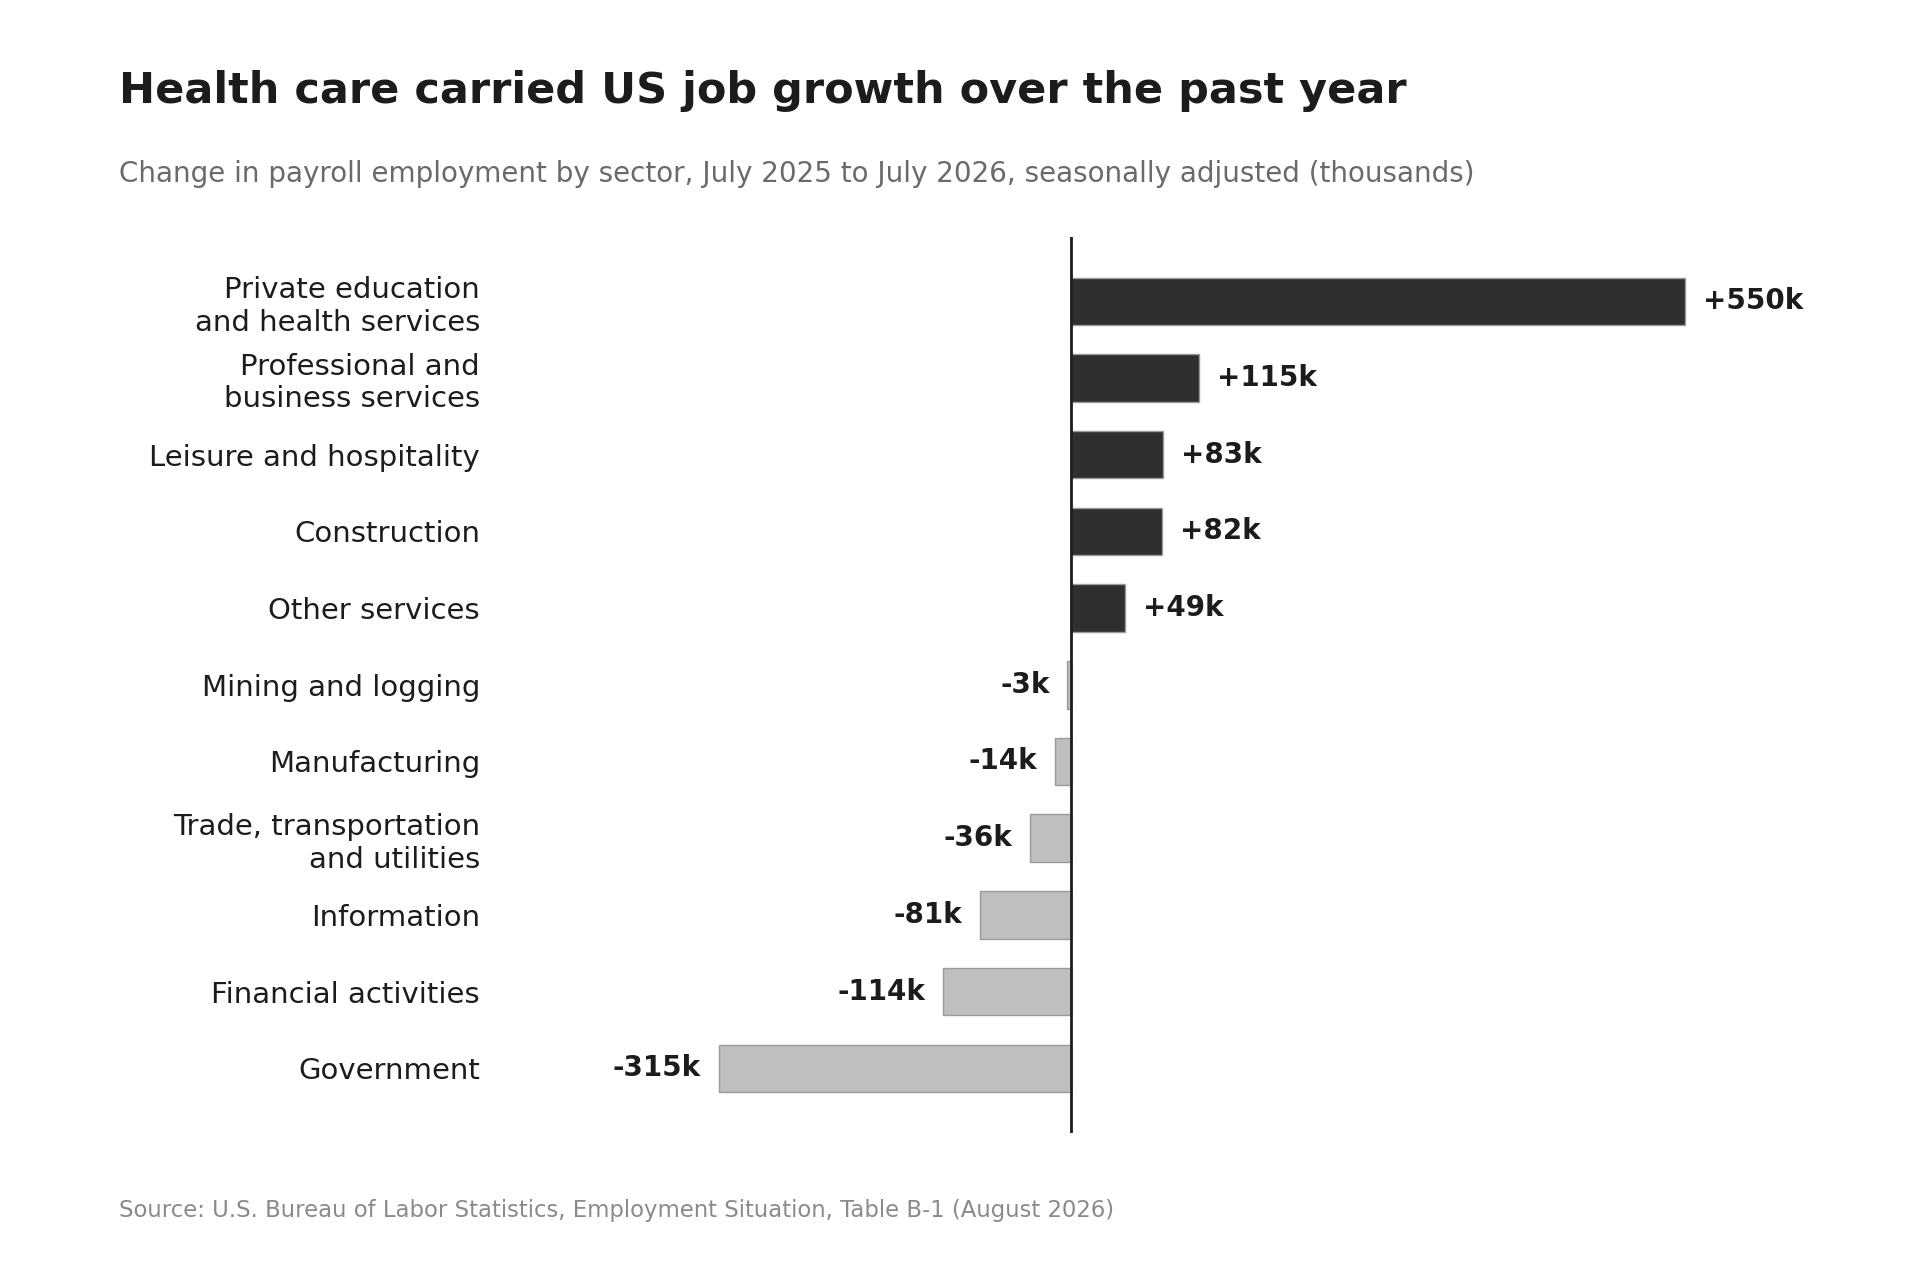
How This Report Defines the "Biggest" Industries
There are three defensible ways to rank an industry, and they produce three different leaderboards.
- Value added (GDP share) measures the economic output an industry contributes after subtracting the inputs it consumed. This is the Bureau of Economic Analysis standard and it favors capital-intensive, high-margin sectors such as real estate and finance.
- Employment measures headcount. This favors labor-intensive sectors such as health care, retail and food service, which can employ millions while contributing a smaller share of output.
- Revenue or spending flow measures gross dollars moving through a sector. This is why US health care is often described as an 18 percent-of-GDP industry, even though health care value added is closer to 8 percent. Spending includes insurance flows, drugs, devices and administration; value added does not double count them.
A serious ranking uses all three. Where this report cites a single figure, the measure is named.
The State of the US Economy Heading Into This Breakdown
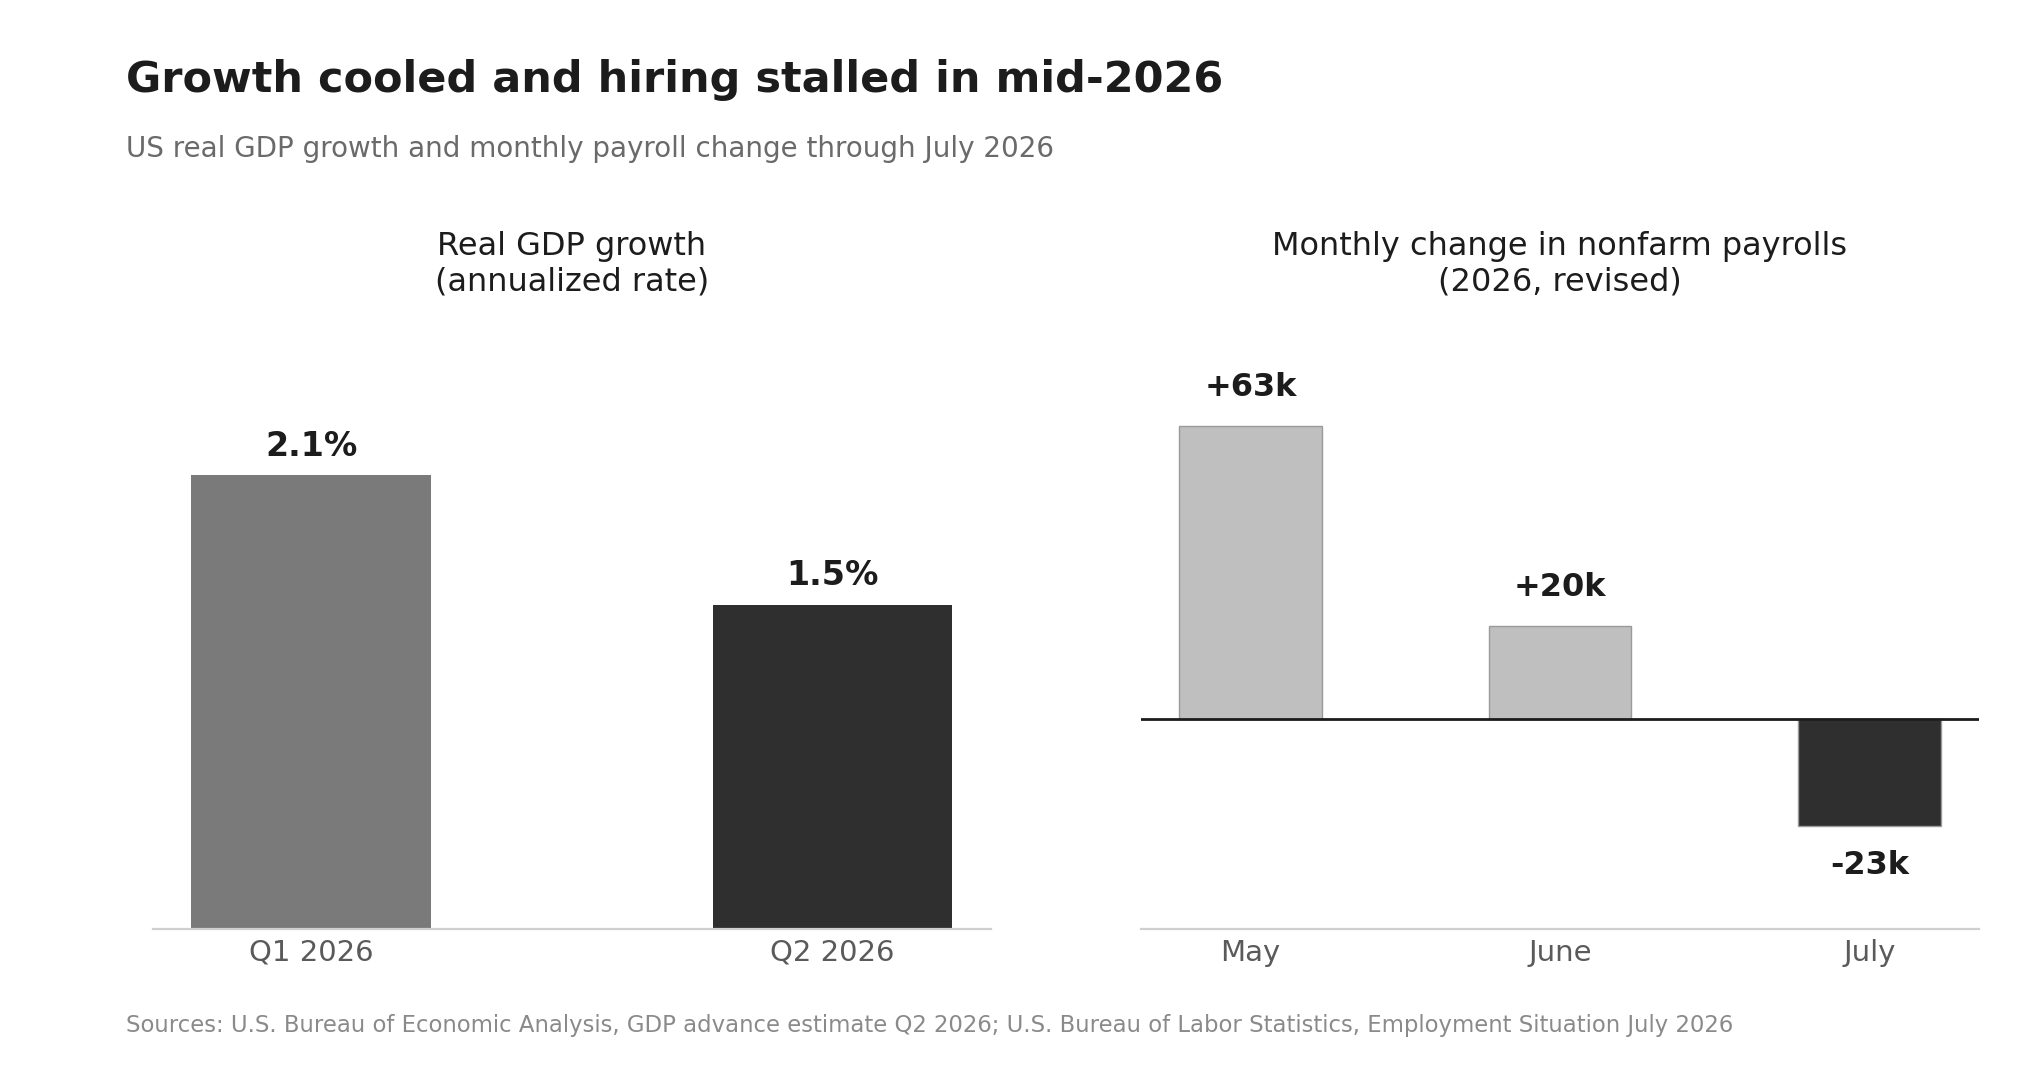
Real GDP grew at an annual rate of 1.5 percent in the second quarter of 2026, down from 2.1 percent in the first quarter, with consumer spending, investment and exports driving the gain and government spending subtracting from it (Source: U.S. Bureau of Economic Analysis).
The labor market is close to flat. Total nonfarm payroll employment changed little in July 2026 at a decline of 23,000, the unemployment rate held at 4.1 percent, and May and June were revised down by a combined 103,000 jobs (Source: U.S. Bureau of Labor Statistics).
That backdrop matters. In a 1.5 percent growth economy with flat hiring, industry rankings are no longer moved by broad expansion. They are moved by a small number of sectors pulling hard in opposite directions, which is exactly what the 2026 data shows.
Biggest US Industries by GDP Contribution
Value added by industry is released quarterly by the BEA.
In the first quarter of 2026, real value added rose 7.5 percent for government, 4.5 percent for private goods-producing industries and just 0.8 percent for private services-producing industries (Source: U.S. Bureau of Economic Analysis).
| Industry group | Approximate share of GDP | Character |
|---|---|---|
| Real estate, rental and leasing | ~13.7% | Largest single output contributor |
| Professional and business services | ~13% | Consulting, legal, engineering, admin |
| Government (federal, state, local) | ~11% | Non-market output, defense, education |
| Manufacturing | ~10% | Durable and nondurable goods |
| Finance and insurance | ~8% | Banking, securities, carriers |
| Health care and social assistance | ~8% | Value added, not total spending |
| Wholesale and retail trade | ~11% combined | Distribution and consumer sales |
| Information | ~6% | Software, telecom, media, data |
| Construction | ~4% | Residential and nonresidential |
Sources: U.S. Bureau of Economic Analysis, Federal Reserve Bank of St. Louis.
Real estate leads because the measure includes imputed rent on owner-occupied housing, a large non-cash component.
Finance and insurance value added has been near 8.0 percent of GDP (Source: Federal Reserve Bank of St. Louis), while manufacturing has settled around 10 percent (Source: Federal Reserve Bank of St. Louis).
Biggest US Industries by Employment
Employment tells a different story. Here are seasonally adjusted July 2026 payroll levels.
| Sector | Employees (July 2026) |
|---|---|
| Trade, transportation and utilities | 28.71 million |
| Private education and health services | 27.96 million |
| Government | 23.27 million |
| Professional and business services | 22.52 million |
| Leisure and hospitality | 16.93 million |
| Manufacturing | 12.61 million |
| Financial activities | 9.09 million |
| Construction | 8.34 million |
| Other services | 6.04 million |
| Information | 2.78 million |
| Mining and logging | 0.61 million |
Source: U.S. Bureau of Labor Statistics.
Within those groups, the largest individual industries are health care at 18.52 million, retail trade at 15.44 million, local government at 15.12 million, food services and drinking places at 12.35 million, transportation and warehousing at 6.60 million, and wholesale trade at 6.06 million (Source: U.S. Bureau of Labor Statistics).
Health Care: The Largest and Most Reliable Job Engine
Health care is the only major US industry adding jobs consistently.
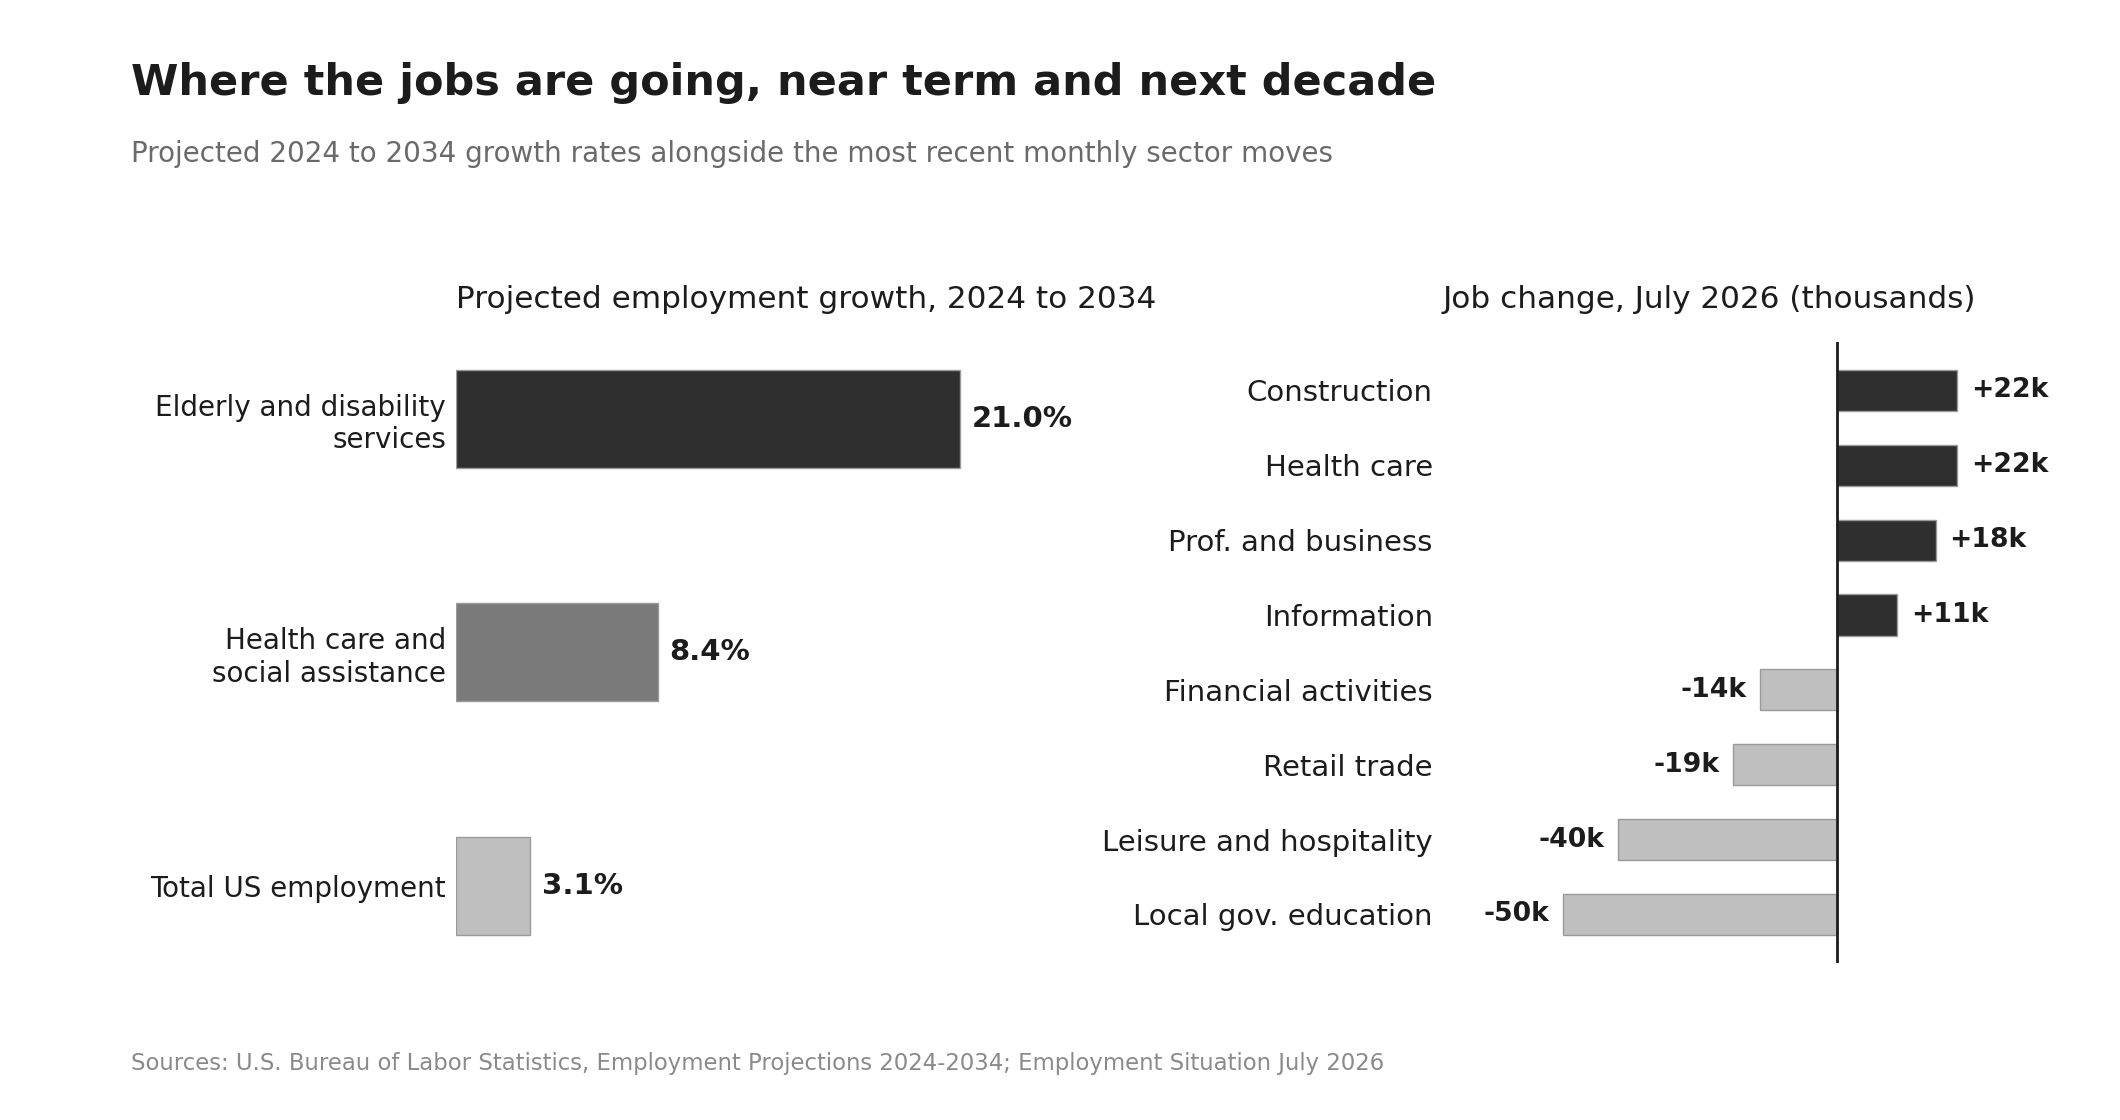
In July 2026 it added 22,000 positions, below its 36,000 average monthly gain over the prior 12 months but positive in a month when total payrolls fell (Source: U.S. Bureau of Labor Statistics).
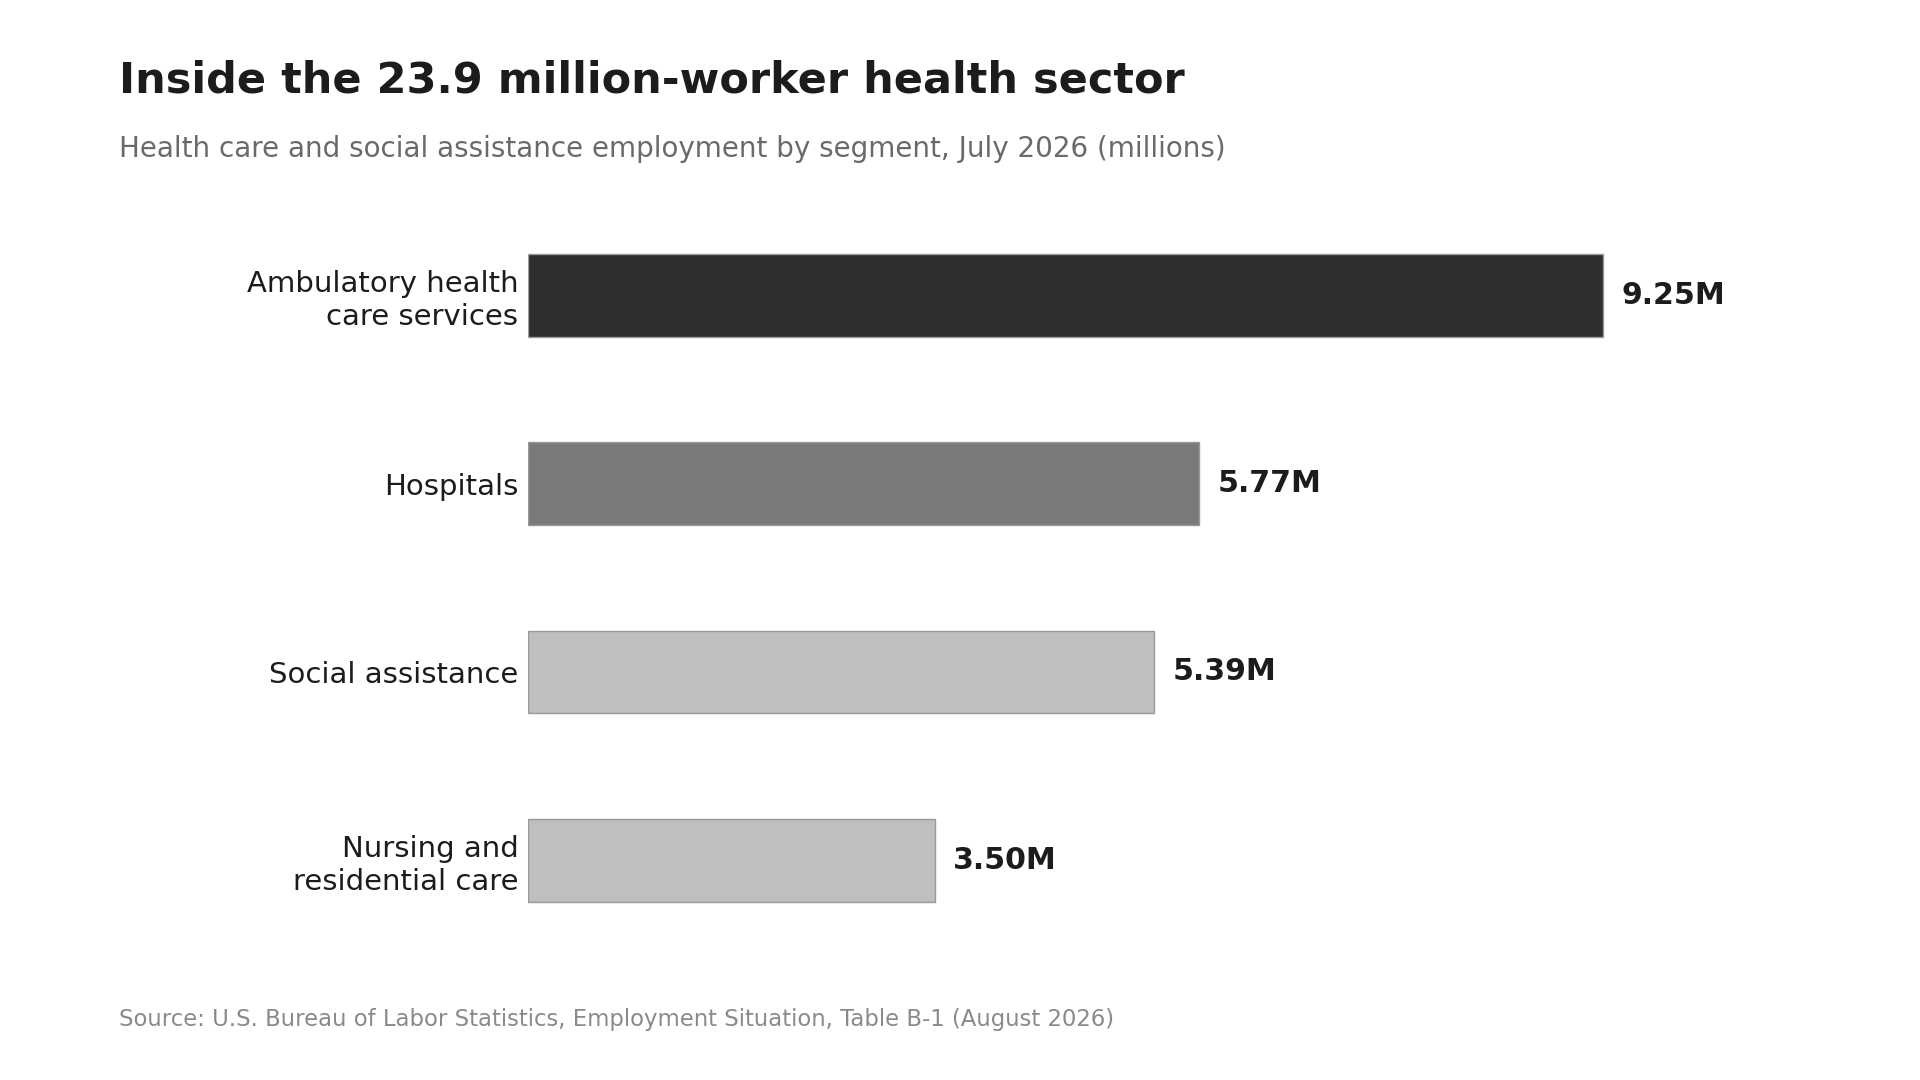
The internal breakdown: ambulatory health care services 9.25 million, hospitals 5.77 million, nursing and residential care 3.50 million, and social assistance an additional 5.39 million (Source: U.S. Bureau of Labor Statistics).
On the spending side, national health expenditures are projected to have reached $5.7 trillion in 2025, growth of 7.3 percent, a third consecutive year above 7 percent and faster than nominal GDP growth of 5.0 percent, with spending reaching nearly $9.0 trillion by 2034 (Source: Health Affairs).
US health spending accounted for 18.0 percent of GDP in 2024 at $15,474 per person (Source: Centers for Medicare & Medicaid Services).
Retail and Consumer Trade: Highest Volume, Lowest Pay
Retail and food services sales reached $763.6 billion in July 2026 alone, up 5.0 percent year over year, with the May to July period up 6.3 percent (Source: U.S. Census Bureau).
Employment is moving the other way.
Retail trade lost 19,000 jobs in July 2026, including 21,000 at warehouse clubs, supercenters and general merchandise retailers (Source: U.S. Bureau of Labor Statistics).
Sales are rising while headcount falls, which is the clearest automation signal in the dataset.
Manufacturing and Construction: Flat Headcount, Structural Shifts
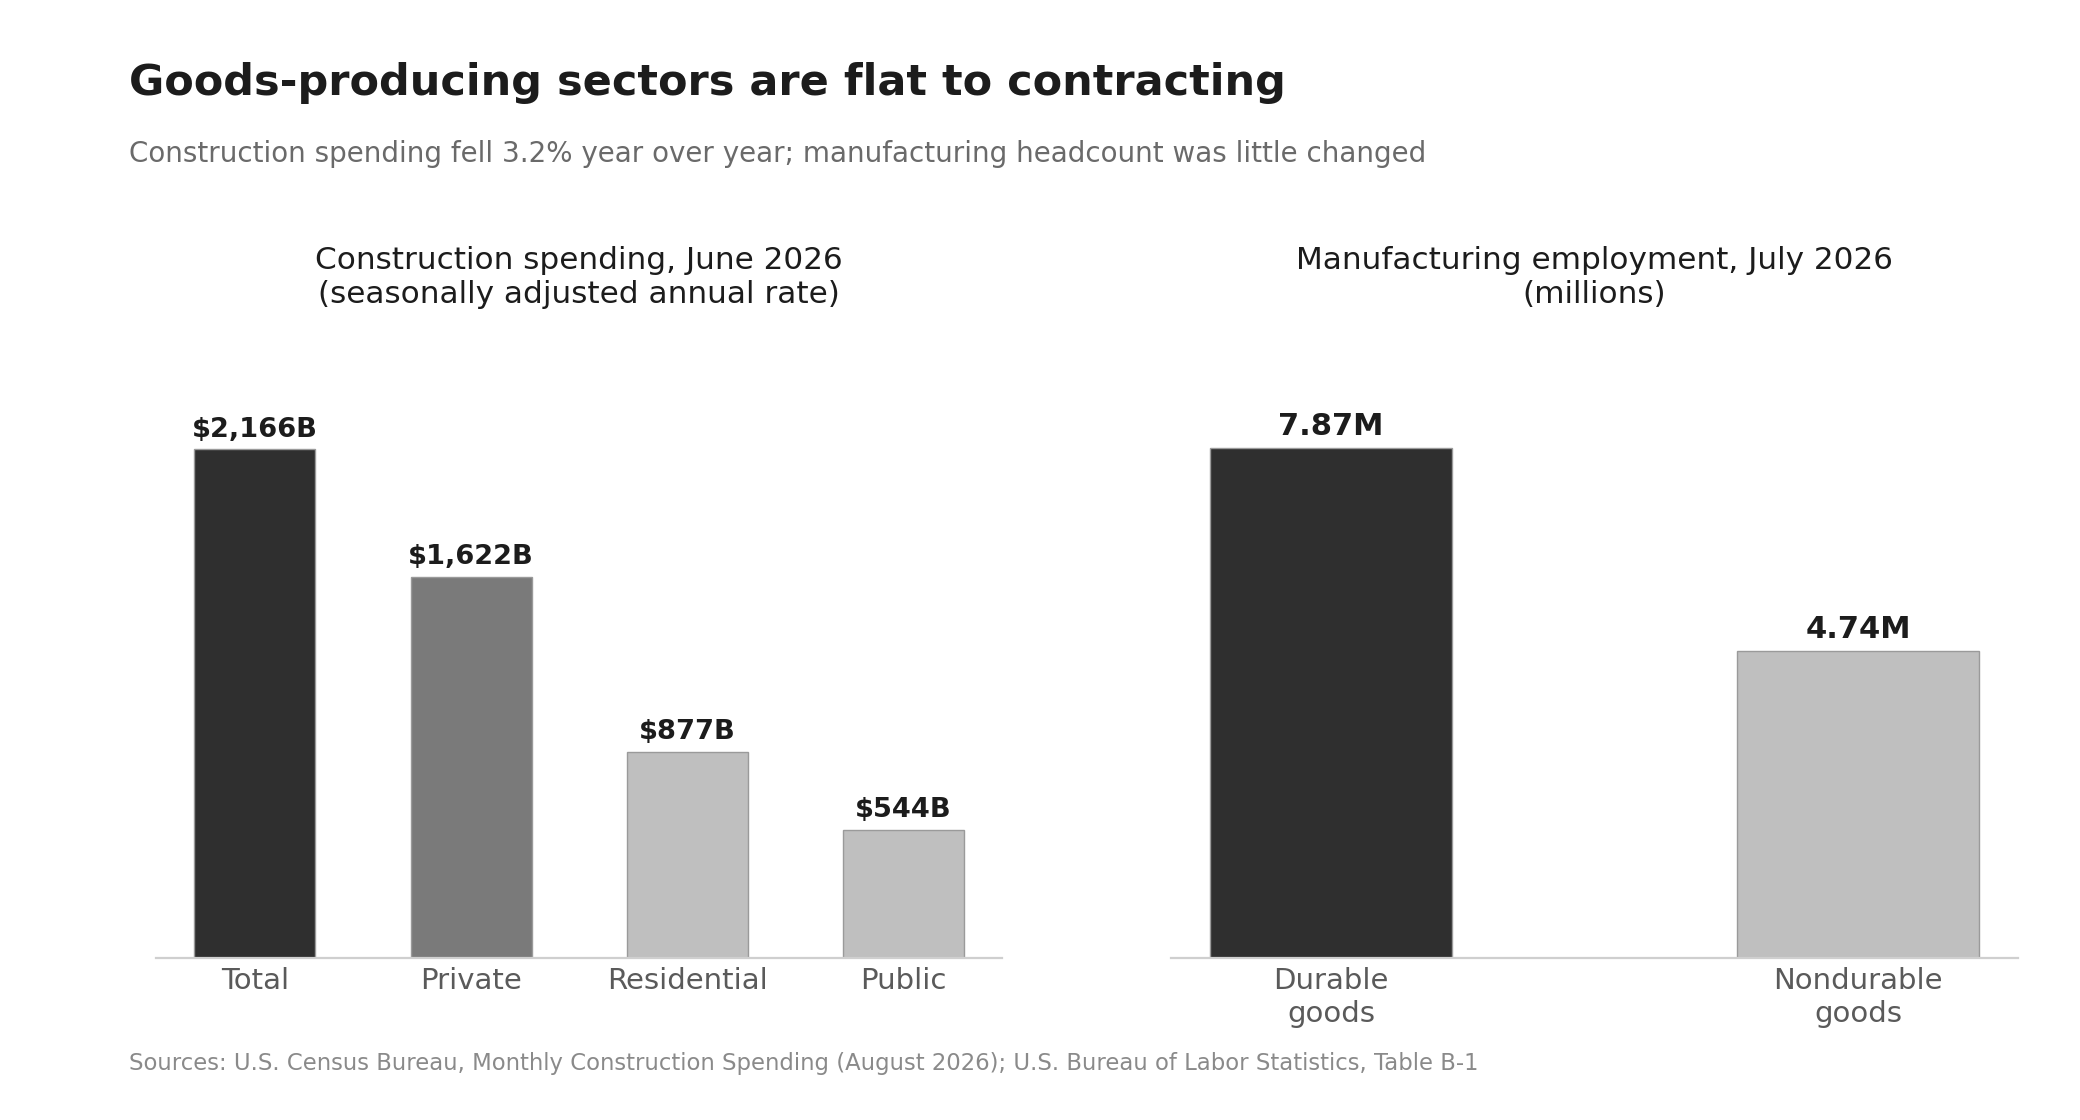
Manufacturing employed 12.61 million in July 2026, essentially unchanged, split between 7.87 million in durable goods and 4.74 million in nondurable goods (Source: U.S. Bureau of Labor Statistics).
Construction employed 8.34 million.
Total construction spending ran at a seasonally adjusted annual rate of $2,166.5 billion in June 2026, 3.2 percent below June 2025, with first-half 2026 spending of $1,046.9 billion down 3.5 percent year over year (Source: U.S. Census Bureau).
Residential construction ran at $877.1 billion.
Finance, Insurance and Real Estate: High Output, Shrinking Payrolls
Financial activities employed 9.09 million in July 2026 and lost 14,000 jobs that month, with credit intermediation down 9,000 and insurance carriers down 7,000.
The sector is down 121,000 jobs since its May 2025 peak (Source: U.S. Bureau of Labor Statistics).
This is the clearest example of the output-employment gap in the US economy.
FIRE industries contribute more than 20 percent of GDP combined while employing under 6 percent of workers.
Average Salaries by Industry
Average weekly earnings for all private employees reached $1,290.37 in July 2026, with average hourly earnings of $37.62, up 3.2 percent year over year (Source: U.S. Bureau of Labor Statistics).
| Industry | Avg. hourly | Avg. weekly | Annualized |
|---|---|---|---|
| Utilities | $56.34 | $2,400.08 | ~$124,800 |
| Information | $55.70 | $2,066.47 | ~$107,500 |
| Mining and logging | $42.11 | $1,941.27 | ~$100,900 |
| Financial activities | $49.44 | $1,849.06 | ~$96,200 |
| Professional and business services | $45.68 | $1,676.46 | ~$87,200 |
| Construction | $41.46 | $1,637.67 | ~$85,200 |
| Wholesale trade | $39.88 | $1,571.27 | ~$81,700 |
| Manufacturing | $36.87 | $1,489.55 | ~$77,500 |
| Transportation and warehousing | $32.63 | $1,243.20 | ~$64,600 |
| Private education and health services | $36.18 | $1,186.70 | ~$61,700 |
| Other services | $34.05 | $1,096.41 | ~$57,000 |
| Retail trade | $26.23 | $786.90 | ~$40,900 |
| Leisure and hospitality | $23.63 | $600.20 | ~$31,200 |
Source: U.S. Bureau of Labor Statistics.
Annualized figures are weekly earnings multiplied by 52 and assume full-year work.
The spread is the story: a utilities worker earns roughly four times a leisure and hospitality worker per week, and the two largest employment sectors by headcount sit at the bottom of the pay table.
Which Industries Are Growing and Which Are Shrinking
The US economy is projected to add 5.2 million jobs from 2024 to 2034, reaching 175.2 million total employment, growth of 3.1 percent and far slower than the 13.0 percent recorded over 2014 to 2024 (Source: U.S. Bureau of Labor Statistics).
Health care and social assistance is projected to be both the largest and fastest-growing sector at 8.4 percent, adding roughly 2 million jobs.
Services for the elderly and persons with disabilities is projected to grow 21.0 percent and add 528,500 jobs, the most of any detailed industry (Source: U.S. Bureau of Labor Statistics).
On the occupational side, information security analysts are projected to grow 28.5 percent and add 52,100 jobs, data scientists 33.5 percent and 82,500 jobs, and nurse practitioners 40.1 percent and 128,400 jobs (Source: U.S. Bureau of Labor Statistics).
Contracting: financial activities, retail trade, local government education, which shed 50,000 jobs in July 2026, and information, which is down roughly 80,000 jobs year over year (Source: U.S. Bureau of Labor Statistics).
The AI Buildout Is Redrawing the Industry Map
The single largest structural change in the 2026 industry landscape is not a sector, it is a capital flow.
Investment in AI data center construction, compute hardware and networking reached about 1.4 percent of US GDP in Q1 2026, up from roughly 0.7 percent, making AI infrastructure the leading driver of growth in US private investment (Source: Epoch AI).
Total AI investment is forecast to reach roughly $1 trillion globally and just under $600 billion in the US in 2026, rising from 1.8 percent of US GDP in 2026 to 2.8 percent by 2028 (Source: Goldman Sachs).
By the most conservative measure, tech and data center investment accounted for about 36 percent of year-over-year real GDP growth in Q2 2026, with broader definitions putting the figure above 50 percent (Source: ING).
The practical implication: information, utilities and nonresidential construction are being pulled upward by a demand source that did not meaningfully exist five years ago, while the same technology is suppressing headcount in retail, finance and back-office professional services.
What This Means for Workers, Operators and Investors
- For workers. The two largest employment sectors pay the least, and the two highest-paying sectors are among the smallest by headcount.
Utilities, information and financial activities together employ under 12.5 million people. The reliable growth path is health care, where demand is demographic rather than cyclical, or specialized technical roles tied to AI infrastructure.
- For operators. Nonresidential specialty trade contracting added 15,400 jobs in July 2026 while residential specialty trades were nearly flat (Source: U.S. Bureau of Labor Statistics). Capacity is migrating toward data centers, power and industrial work.
- For investors. Concentration risk is now explicit. When a single investment theme accounts for a third or more of GDP growth, the industry rankings published today are more fragile than they look. A slowdown in AI capex would hit information, utilities and construction simultaneously.
Conclusion
This report set out to answer a question that most sources answer badly, and the data supports a clear conclusion.
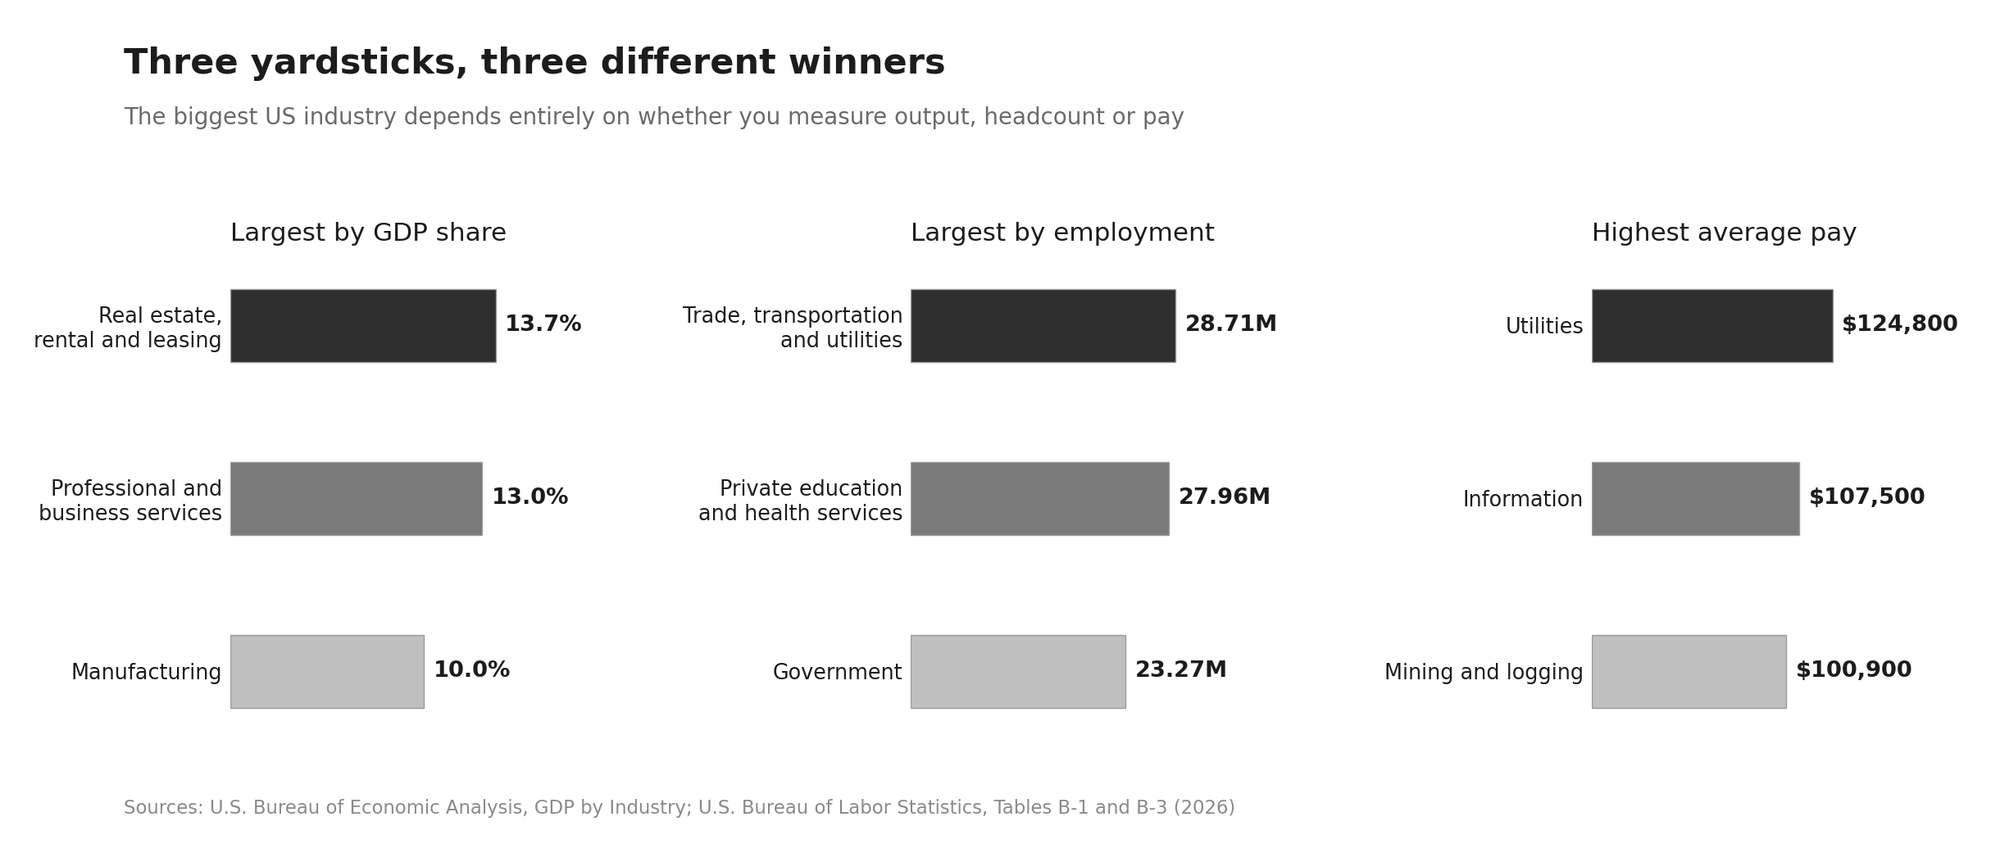
The biggest industries in the US depend entirely on the yardstick: real estate and professional services lead on output, trade and health care lead on employment, and utilities and information lead on pay.
Health care is the one sector that ranks near the top on scale, growth and durability at once, adding jobs in months when the overall economy is shedding them.
Meanwhile, AI infrastructure investment has become the swing factor in the entire ranking, propping up growth in information, utilities and nonresidential construction while accelerating headcount declines in retail and finance.
Any assessment of the largest US industries made without accounting for that concentration is already out of date.
Read Next
- Best Fleet Management Software in 2026
- How AI Became Embedded in Everyday Software
- AI Agents vs. Workflow Automation Tools
FAQs
1. What is the biggest industry in the US by GDP?
The biggest industry in the US by GDP is real estate, rental and leasing, contributing roughly 13.7 percent of national output, followed closely by professional and business services (Source: U.S. Bureau of Economic Analysis).
2. What is the biggest industry in the US by employment?
The biggest industry in the US by employment is health care, with 18.52 million workers as of July 2026, ahead of retail trade at 15.44 million (Source: U.S. Bureau of Labor Statistics).
3. Which US industry pays the highest average salary?
The US industry that pays the highest average salary is utilities, at $2,400.08 per week or roughly $124,800 annualized, followed by information at about $107,500 (Source: U.S. Bureau of Labor Statistics).
4. Which US industries are growing the fastest through 2034?
The US industries growing the fastest through 2034 are health care and social assistance at 8.4 percent, led by services for the elderly and persons with disabilities at 21.0 percent (Source: U.S. Bureau of Labor Statistics).
5. How much of US GDP growth comes from AI and data centers in 2026?
AI and data center investment accounts for roughly 36 to 50 percent of year-over-year US GDP growth in 2026, depending on how tech investment is defined (Source: ING).
Disclaimer: This content is provided for informational purposes only and does not constitute legal, financial, or compliance advice. Protocol versions, governance arrangements, and partner counts cited here reflect publicly announced milestones as of August 2026 and are moving quickly. Adoption figures come from vendor and foundation announcements with differing methodologies and should be treated as directional signals rather than guaranteed outcomes.